# datavjs
**Repository Path**: hl0071/datavjs
## Basic Information
- **Project Name**: datavjs
- **Description**: DataV
- **Primary Language**: Unknown
- **License**: MIT
- **Default Branch**: master
- **Homepage**: None
- **GVP Project**: No
## Statistics
- **Stars**: 0
- **Forks**: 1
- **Created**: 2025-05-06
- **Last Updated**: 2025-05-06
## Categories & Tags
**Categories**: Uncategorized
**Tags**: None
## README
DataV.js
============
DataV.js 是一个 JavaScript 的数据可视化库,致力于推动数据可视化在普通业务的落地应用。
我们的目标是:
> 凡有数据在处,皆能可视化

- [API文档](http://tbedp.github.com/datavjs/index.html)
- 任意疑问,请移至底下联系人部分即可。
## 安装
目前处于开发中,并未release正式版本,如需使用,请采用如下方式:
```bash
$ git clone git://github.com/TBEDP/datavjs.git
```
需要注意的是 [example](https://github.com/TBEDP/datavjs/tree/master/example) 目录下的例子中有 `ajax` 存在,所以你需要一个服务器来托管这些静态文件。
你也可以试用基于 DataV.js 开发的 [Chrome插件](https://chrome.google.com/webstore/detail/datavjs/fkekhkndcgobgjbkclehjognobgdoppm),可以在任意网页中将表格可视化。
## Examples
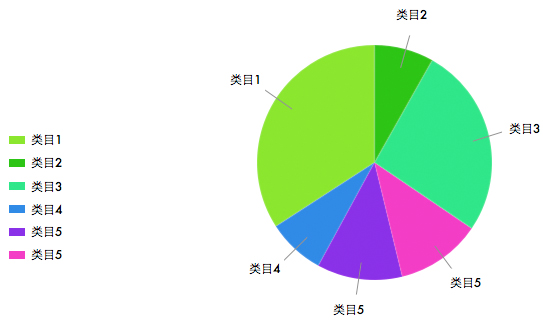
- [Pie](http://datavlab.org/datavjs/#pie)
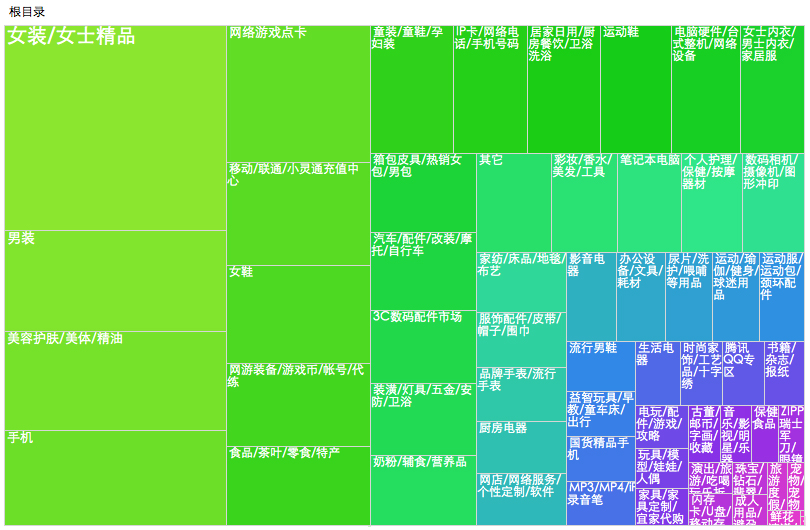
- [Treemap](http://datavlab.org/datavjs/#treemap)
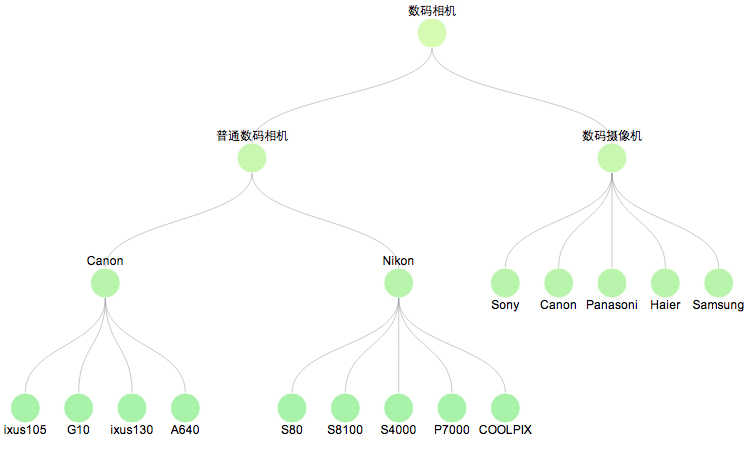
- [Tree](http://datavlab.org/datavjs/#tree)
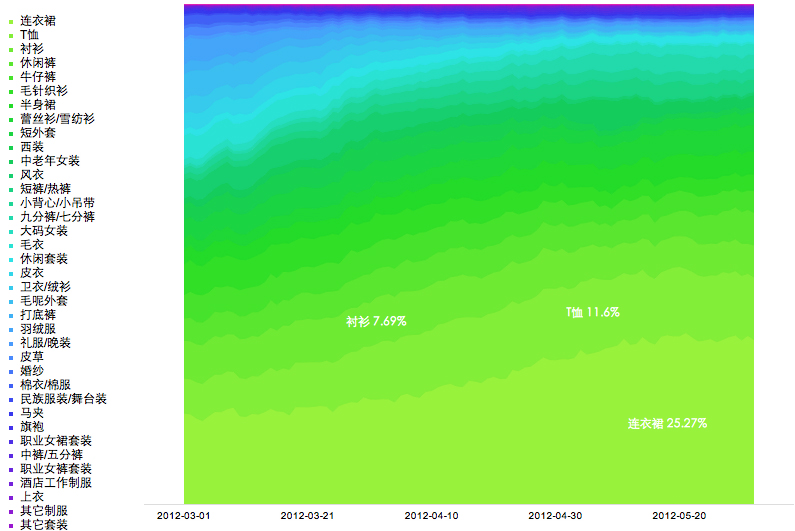
- [Stream](http://datavlab.org/datavjs/#stream)
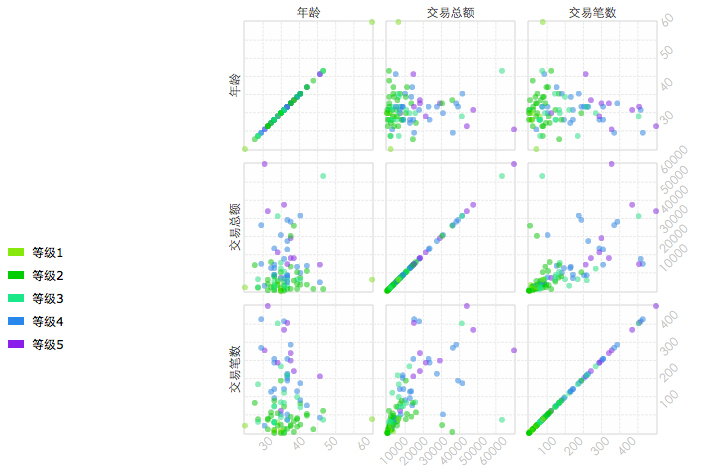
- [ScatterplotMatrix](http://datavlab.org/datavjs/#scatterplotMatrix)
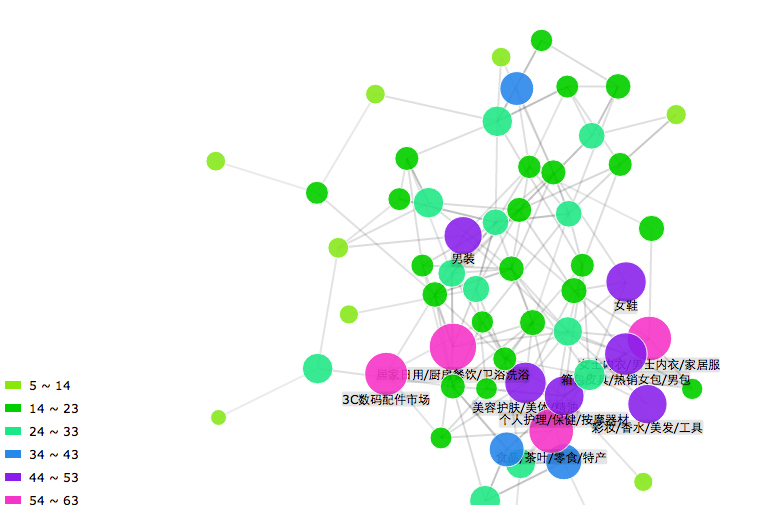
- [Force](http://datavlab.org/datavjs/#force)
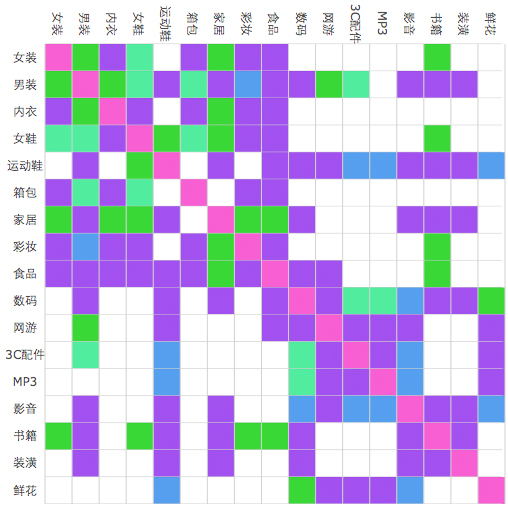
- [Matrix](http://datavlab.org/datavjs/#matrix)
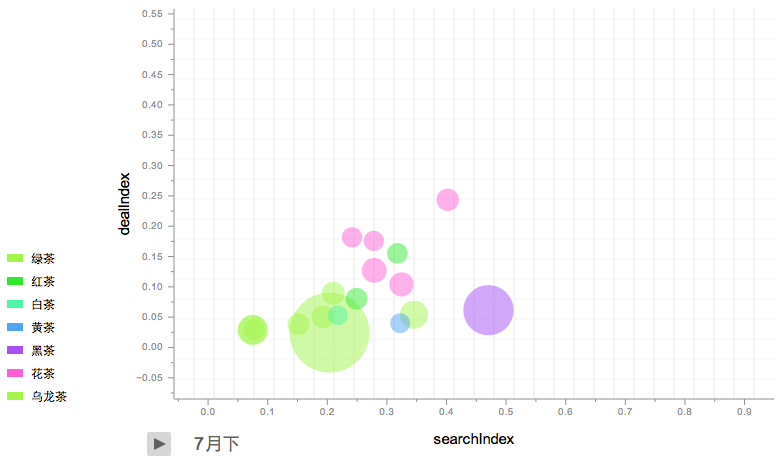
- [Bubble](http://datavlab.org/datavjs/#bubble)
- [Chord](http://datavlab.org/datavjs/#chord)
- [Gender 性别图](https://github.com/TBEDP/datavjs/tree/master/example/gender)

## Quick start
此处以Pie图为例。
### 引入依赖
```html
```
### 准备数据
```js
var source = [
['北京', 50265],
['上海', 60555],
['广州', 38544],
['深圳', 27276],
['西安', 20506],
['昆明', 26916],
['武汉', 17636],
['拉萨', 977],
['哈尔滨', 10406],
['乌鲁木齐', 6695]
];
```
### 渲染图表
```js
// 初始化组件
var pie = new Pie("container", {width: 1000, tag: true});
// 添加数据源
pie.setSource(source);
// 渲染
pie.render();
```
### 结果:

## Requirements:
* [D3.js](https://github.com/mbostock/d3).
* [Raphael.js](http://raphaeljs.com/).
* [Sea.js](https://github.com/seajs/seajs).
## Learn more?
- The example site:
- [API Docs](http://tbedp.github.com/datavjs/)
## Contributors
Thanks goes to the people who have contributed code to this library, see the [GitHub Contributors](https://github.com/TBEDP/datavjs/graphs/contributors) page.
Below is the output from `git-summary`
```bash
$ git summary
project : datavjs
repo age : 1 year
active : 159 days
commits : 431
files : 276
authors :
305 Jackson Tian 70.8%
46 jdk137 10.7%
25 xie cong 5.8%
18 gozo1234 4.2%
11 Theseue 2.6%
8 xiecong 1.9%
8 wxtheseue 1.9%
4 Jiang Dongke 0.9%
3 郭方舟 0.7%
2 unknown 0.5%
1 arcthur 0.2%
```
## License
DataV.js is available under the [MIT License](https://github.com/TBEDP/datavjs/blob/master/MIT-License).
## Contact
组件由淘宝数据产品部可视化小组以及浙大CAD&CG可视化与可视分析小组共同开发
开发联系人,有问题可咨询:
- 阿里旺旺
- 朴灵[](http://amos1.taobao.com/msg.ww?v=2&uid=%E6%9C%B4%E7%81%B5&s=1)
- 宁朗[](http://amos1.taobao.com/msg.ww?v=2&uid=%E5%AE%81%E6%9C%97&s=1)
- 法慧[](http://amos1.taobao.com/msg.ww?v=2&uid=%E6%B3%95%E6%85%A7&s=1)
- 解聪(浙大实习生)[](http://amos1.taobao.com/msg.ww?v=2&uid=%E9%95%BF%E4%BA%AD%E7%9A%84%E8%8B%8F%E5%B9%95%E9%81%AE&s=1)
- 黄芯芯(浙大实习生)[](http://amos1.taobao.com/msg.ww?v=2&uid=littlemonkey007&s=1)
- 阿里旺旺群:76480715
- QQ群: 18164936
- Google Group: [DataVLab](http://groups.google.com/group/datavlab)
- Gtalk:
- 浙大CAD&CG可视化与可视分析小组: [VAG Wiki](http://www.cad.zju.edu.cn/home/vagwiki/index.php)
如有疑问,或发现Bug,也可[提交Bug](https://github.com/TBEDP/datavjs/issues/new)