# AI-in-One-Dashboard
**Repository Path**: mirrors_microsoft/AI-in-One-Dashboard
## Basic Information
- **Project Name**: AI-in-One-Dashboard
- **Description**: AI-in-One Dashboard Power BI template for comprehensive AI usage analytics
- **Primary Language**: Unknown
- **License**: MIT
- **Default Branch**: main
- **Homepage**: None
- **GVP Project**: No
## Statistics
- **Stars**: 0
- **Forks**: 0
- **Created**: 2025-10-19
- **Last Updated**: 2025-10-20
## Categories & Tags
**Categories**: Uncategorized
**Tags**: None
## README
# 🤖 AI-in-One Dashboard
This repository contains the AI-in-One Dashboard Power BI template. This report provides comprehensive insights into Microsoft Copilot and Agent adoption, empowering AI and business leaders to make informed decisions regarding AI implementation, licensing, and enablement strategies.
---
⚠️ Important usage & compliance disclaimer
Please note:
While this tool helps customers better understand their AI usage data, Microsoft has **no visibility** into the data that customers input into this template/tool, nor does Microsoft have any control over how customers will use this template/tool in their environment.
Customers are solely responsible for ensuring that their use of the template tool complies with all applicable laws and regulations, including those related to data privacy and security.
**Microsoft disclaims any and all liability** arising from or related to customers' use of the template tool.
**Experimental Template Notice:**
This is an experimental template. On occasion, you may notice small deviations from metrics in the official Copilot and Agent Dashboards. We will continue to iterate based on your feedback. Currently available in English only.
---
## 📊 What This Dashboard Provides
- **Comprehensive visibility into M365 Copilot, unlicensed Copilot Chat, and Agent usage** across your organization
- **User engagement tracking over time** to identify adoption patterns and trends across all Copilot surfaces
- **Data-driven insights** to optimize AI investments, license allocation, and employee enablement
- **Customizable views** to segment data by department, role, or other organizational dimensions
---
## 🚀 How This Helps Leaders
- **Make informed AI and Microsoft Copilot investment decisions** using comprehensive usage data and analytics consolidated in one place
- **Identify Copilot and Agent adoption champions** and areas needing additional enablement
- **Optimize enablement and change management efforts** based on actual usage patterns across M365 Copilot, unlicensed Copilot Chat, and Agents
- **Accelerate AI readiness, adoption, and impact** across the organization—from licensed Copilot experiences to emerging Agent capabilities
---
## ✅ What You'll Do
📤 Step 1: Export 4 Data Sources
- **Person query** from Microsoft Viva Insights
- **Copilot interactions audit log** from Microsoft Purview
- **Copilot licensed user list** from Microsoft 365 Admin Center
- **Org data** from Microsoft Entra Admin Center
🔐 Step 2: Connect Files to Power BI Template
- Set up Direct Query connection to Viva Insights
- Paste full file paths for each CSV into the Power BI template
---
## 📁 Detailed Steps
📊 Step 1: Build the Person Query (Viva Insights)
### What This Data Provides
This query provides comprehensive Microsoft 365 Copilot usage metrics aggregated by person and day, enabling you to track adoption patterns and user engagement over time.
### Requirements
- Access level required: **Insights Administrator** or **Insights Analyst**
- Portal: Microsoft Viva Insights
- Permissions needed: Access to create and run Person Queries
### Step-by-Step Instructions
1. **Navigate to the portal**
- Go to: [https://analysis.insights.viva.office.com/Analysis/CreateAnalysis](https://analysis.insights.viva.office.com/Analysis/CreateAnalysis)
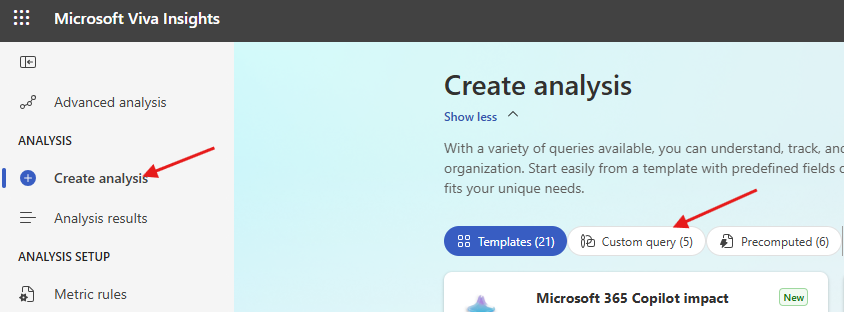
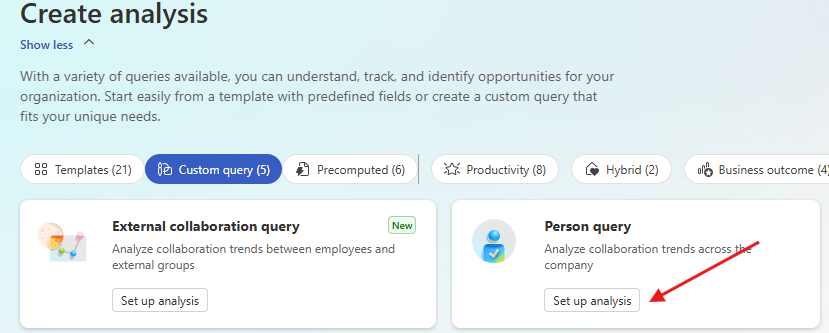
2. **Select Person Query**
- Click **Person Query** → **Set up analysis**
3. **Configure query settings**
- **Time period**: Last 3 months (rolling)
- **Auto-refresh**: Enable weekly refresh (optional but recommended—this will automatically refresh in Power BI)
- **Group by**: Day
- **Metrics**: Select all **M365 Copilot** metrics
- **Filter**: Set `Is Active = True` (if available) to validate employee count
- **Attributes**:
- **Required**: `Organization`
- **Optional**: Include any additional attributes you want for reporting (department, role, location, etc.)
4. **Save and run query**
- Click **Save & Run**
- Wait until **Status = Completed** (first runs can take several hours)
- ⚠️ Do not export or connect until processing is complete
### Expected Output
- **File format**: Direct Query (no download needed)
- **Refresh frequency**: Weekly (if auto-refresh enabled)
- **Data granularity**: Daily metrics per person
💡 **Tip**: The more attributes you include in Step 3, the more flexibility you'll have for segmentation and filtering in the dashboard.
🔍 Step 2: Download Copilot Interactions Audit Logs (Microsoft Purview)
### What This Data Provides
This log provides detailed records of Copilot interactions across all surfaces (Chat, M365 apps, Agents), enabling deep analysis of usage patterns and engagement.
### Requirements
- Access level required: **Audit Reader** or **Compliance Administrator**
- Portal: Microsoft Purview Compliance Portal
- Permissions needed: View and export audit logs
### Step-by-Step Instructions
1. **Navigate to the portal**
- Go to: [security.microsoft.com](https://security.microsoft.com)
- In the left pane, scroll down and click **Audit**
- Ensure you have appropriate compliance roles (e.g., **Audit Reader**). If not, contact your IT admin
2. **Configure the audit search**
- In **Activities > Friendly Names**, select:
`Copilot Activities – Interacted with Copilot`
- Set a **Date Range** (recommended: 1–3 months to match your Viva query)
- Give your search a descriptive name (e.g., "Copilot Audit Export - Oct 2025")
3. **Run and export the search**
- Click **Search**
- Wait until the status changes to **Completed**
- Click into the completed search
- Select **Export > Download all results**
- Save the CSV file to a known location (e.g., `C:\Data\Copilot_Audit_Logs.csv`)
### Expected File Format
- **File format**: CSV
- **Typical size**: Varies widely (5 MB–500 MB depending on org size and activity)
- **Columns**: ~50+ columns including timestamps, user IDs, activity types, surfaces
- **Rows**: One row per Copilot interaction
📖 **Learn more**: [Export, configure, and view audit log records – Microsoft Learn](https://learn.microsoft.com/en-us/microsoft-365/compliance/audit-log-search)
👤 Step 3: Download Copilot Licensed User List (Microsoft 365 Admin Center)
### What This Data Provides
This data provides a list of users with Copilot licenses, enabling you to track license utilization and identify licensed vs. unlicensed usage patterns.
### Requirements
- Access level required: **Global Administrator** or **Reports Reader**
- Portal: Microsoft 365 Admin Center
- Permissions needed: View usage reports
### Step-by-Step Instructions
1. **Navigate to the portal**
- Go to: [admin.microsoft.com](https://admin.microsoft.com)
- Log in as a **Microsoft 365 Global Administrator** or **Reports Reader**
2. **Unhide usernames** (if concealed)
- Go to **Settings > Org Settings**
- Under the **Services** tab, choose **Reports**
- **Deselect**: "Display concealed user, group, site names in all reports"
- Click **Save changes**
3. **Navigate to Copilot reports**
- Go to: **Reports > Usage > Microsoft 365 Copilot**
- Click on the **Readiness** tab
4. **Export license data**
- Scroll to **Copilot Readiness Details** section
- Ensure the column `Has Copilot license assigned` is visible
- Click the ellipsis (`...`) menu
- Choose **Export** to download the file as CSV
- Save to a known location (e.g., `C:\Data\Copilot_Licensed_Users.csv`)
### Expected File Format
- **File format**: CSV
- **Typical size**: 1–10 MB for 1,000–10,000 users
- **Columns**: ~10–15 columns including UserPrincipalName, Department, LicenseStatus, LastActivityDate
- **Rows**: One row per user in your organization
📖 **Learn more**: [Microsoft 365 Copilot Readiness Report – Microsoft Learn](https://learn.microsoft.com/en-us/microsoft-365/admin/activity-reports/microsoft-365-copilot-readiness)
📥 Step 4: Access Org Data File (Microsoft Entra or Viva Insights)
### What This Data Provides
This file provides organizational hierarchy and user attributes, enabling segmentation by department, role, location, or other organizational dimensions.
### Requirements
- Access level required: **User Administrator** or **Global Reader** (Entra) OR **Insights Administrator** (Viva)
- Portal: Microsoft Entra Admin Center or Viva Insights
- Permissions needed: View and export user data
### Option A: Export from Microsoft Entra (Recommended)
1. **Navigate to the portal**
- Sign in to: [entra.microsoft.com](https://entra.microsoft.com)
- In the left-hand navigation, go to: `Identity ➝ Users`
2. **Select and download users**
- Click **All users**
- Click the **"Download users"** button (in toolbar or under `...` menu)
3. **Configure the export**
- In the download dialog, select attributes to include:
- **Required fields**:
- `UserPrincipalName`
- `Department`
- **Optional but recommended fields**:
- `JobTitle`
- `Office`
- `City`
- `Country`
- `Manager`
- Any custom attributes relevant for reporting
4. **Download the file**
- Choose **CSV format**
- Click **Download**
- Save to a known location (e.g., `C:\Data\Org_Data_Entra.csv`)
### Option B: Reuse Viva Insights Org Data (Alternative)
If you already uploaded an org data file to Viva Insights for your Person Query, you can use the same file for consistency.
### Expected File Format
- **File format**: CSV
- **Typical size**: 1–20 MB depending on org size and attributes
- **Columns**: Varies (5–30+ columns)
- **Required columns**: UserPrincipalName, Department
- **Rows**: One row per user
💡 **Note**: Avoid downloading non-essential attributes as it can degrade performance and increase file size unnecessarily.
📖 **Learn more**: [Download a list of users – Microsoft Learn](https://learn.microsoft.com/en-us/entra/identity/users/users-bulk-download)
🔐 Step 5: Open and Configure the Power BI Template
### What You'll Do
Connect the Power BI template to your data sources using Direct Query (Viva Insights) and file paths (CSV files).
### Step-by-Step Instructions
1. **Download the template**
- Download **AI-in-One Dashboard - Template.pbit** from this repository
2. **Get Viva Insights connection parameters**
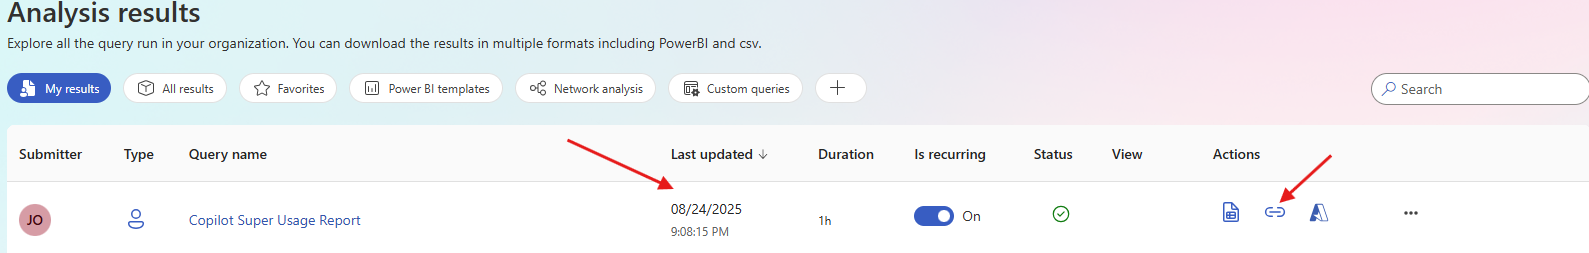
- Go back to your Person Query in Viva Insights: [https://analysis.insights.viva.office.com/Analysis](https://analysis.insights.viva.office.com/Analysis)
- Find your completed query in the list
- Click the **link icon** (🔗) in the row to copy the connection link
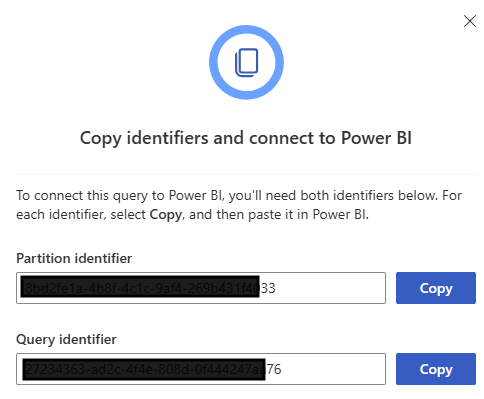
3. **Extract connection identifiers**
- From the copied URL, extract:
- **partitionId**: 36-character GUID (first ID in URL)
- **queryId**: 36-character GUID (second ID in URL)
- Confirm each is exactly 36 characters
4. **Open the template in Power BI Desktop**
- Double-click the `.pbit` file
- A parameter dialog will appear
5. **Enter connection parameters**
- **partitionId**: Paste the 36-character partition ID
- **queryId**: Paste the 36-character query ID
- **Copilot Audit Log Path**: Full path to your audit log CSV
Example: `C:\Data\Copilot_Audit_Logs.csv`
- **Licensed Users Path**: Full path to your licensed users CSV
Example: `C:\Data\Copilot_Licensed_Users.csv`
- **Org Data Path**: Full path to your org data CSV
Example: `C:\Data\Org_Data_Entra.csv`
6. **Load the data**
- Click **Load**
- Wait for all queries to refresh (may take 5–15 minutes on first load)
- If errors occur, verify file paths are correct and files are accessible
7. **Save and publish**
- Save as a `.pbix` file (e.g., `AI-in-One Dashboard.pbix`)
- Publish to your Power BI workspace
- ✅ **No scheduled refresh required** for Viva data (Direct Query auto-refreshes weekly if enabled)
- Configure scheduled refresh for CSV files in Power BI Service (optional)
### Troubleshooting
- **Issue**: "File not found" error
- **Solution**: Verify file paths use absolute paths (e.g., `C:\Data\file.csv`, not `.\file.csv`) and files exist at those locations
- **Issue**: "Could not connect to Viva Insights"
- **Solution**: Verify partitionId and queryId are exactly 36 characters and copied correctly from the URL
- **Issue**: Data refresh takes extremely long
- **Solution**: Check CSV file sizes. Very large audit logs (>500 MB) may need to be filtered or split.
📊 Step 6: Review and Customize
### What You'll Do
Review the dashboard, customize visualizations, and share with stakeholders.
### Recommended Actions
1. **Review dashboard pages**
- Navigate through all report pages
- Verify data loaded correctly
- Check that filters and slicers work as expected
2. **Customize for your organization**
- Update visuals to match your branding (colors, logos)
- Adjust hierarchies to match your org structure
- Add or remove pages based on your needs
- Create bookmarks for common views
3. **Set up filters and parameters**
- Configure default date ranges
- Set up department/role filters
- Create user-specific views if needed
4. **Publish and share**
- Publish to Power BI Service if not already done
- Set up Row-Level Security (RLS) if needed
- Share with stakeholders via workspace access or apps
- Create subscriptions for key reports
5. **Document customizations**
- Keep notes on any changes you make
- Version your .pbix file if making significant updates
- Archive old versions in the `/Archived Templates` folder
### Best Practices
- 🔄 **Refresh schedule**: Set up weekly or monthly refresh for CSV files in Power BI Service
- 🔒 **Security**: Use Row-Level Security to restrict sensitive data by department or role
- 📧 **Subscriptions**: Set up email subscriptions for executives who want regular updates
- 📊 **Usage tracking**: Monitor dashboard usage in Power BI Service to understand what resonates
---
## 📸 Dashboard Preview
### Copilot Usage Analysis
Track Copilot adoption patterns and engagement levels across your organization.

### Copilot Chat Engagement
Monitor unlicensed Copilot Chat usage and user habit formation over time.

### Surface-Level Analysis
Understand which Copilot surfaces (Chat, Teams, Edge, etc.) are driving the most engagement.

### Feature Usage Insights
Deep dive into specific Copilot features and capabilities being used.

### Agent Adoption Tracking
Monitor AI Agent adoption across your organization with user distribution analysis.

### Agent Analytics by Group
Segment agent usage by organizational groups to identify adoption hotspots.

### Agent Type and Name Analysis
Track which specific agents are being deployed and used.

---
## 🔄 Version History
Check the `/Archived Templates` folder for previous versions of the dashboard template.
Current version: **v1.0** (Initial release)
---
## License
This project is licensed under the MIT License - see the [LICENSE.md](LICENSE.md) file for details.
---
## 🔒 Security
Please see [SECURITY.md](SECURITY.md) for information on reporting security vulnerabilities.