# gnuplot-scripts
**Repository Path**: willowish/gnuplot-scripts
## Basic Information
- **Project Name**: gnuplot-scripts
- **Description**: No description available
- **Primary Language**: Unknown
- **License**: MIT
- **Default Branch**: main
- **Homepage**: None
- **GVP Project**: No
## Statistics
- **Stars**: 0
- **Forks**: 0
- **Created**: 2025-11-02
- **Last Updated**: 2025-11-02
## Categories & Tags
**Categories**: Uncategorized
**Tags**: None
## README
 A comprehensive collection of Gnuplot examples
[](https://github.com/iselab-dearborn/gnuplot-scripts/actions/workflows/png.yml)
[](https://github.com/iselab-dearborn/gnuplot-scripts/releases/latest)
[](https://github.com/iselab-dearborn/gnuplot-scripts/graphs/contributors)
[](https://github.com/iselab-dearborn/gnuplot-scripts)
[](https://opensource.org/licenses/mit-license.php)
[](https://github.com/ellerbrock/open-source-badges/)
## Usage
Firstly, install Gnuplot on your machine. Secondly, by using Console, run the gnuplot script with the following command:
```sh
gnuplot script.gnu
```
## Examples
Click in the figures to go directly to the gnuplot script.
### Line and Area Charts
#### Basic Line
#### Area Plot
### Scatter and Bubble Charts
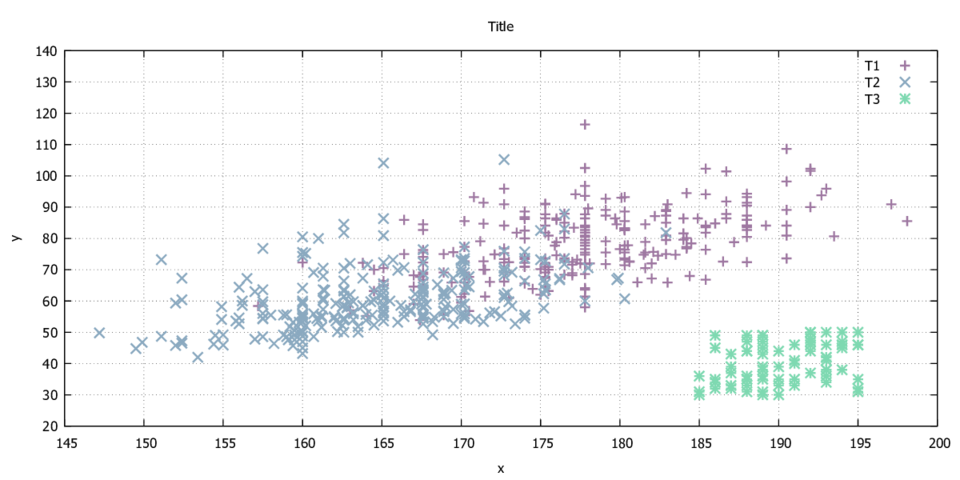
#### Scatter Plot
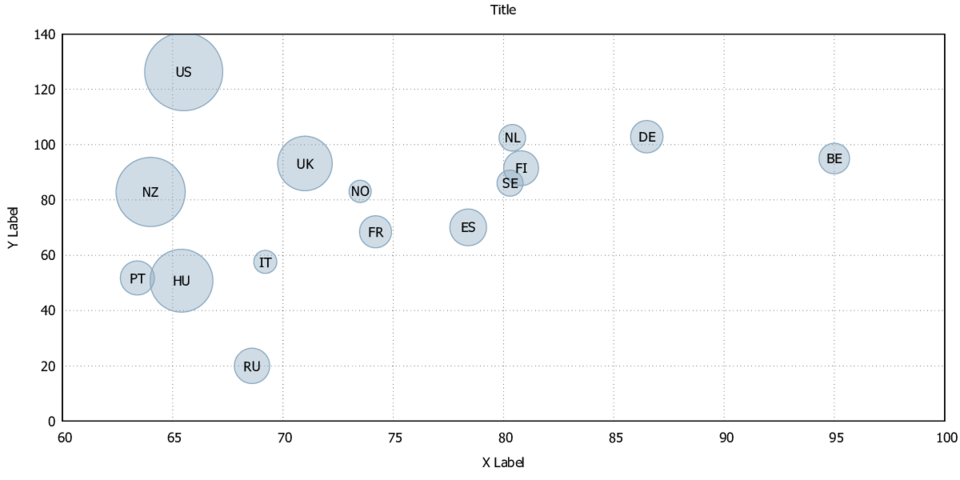
#### Bubble Chart
#### Bubble Chart 3D
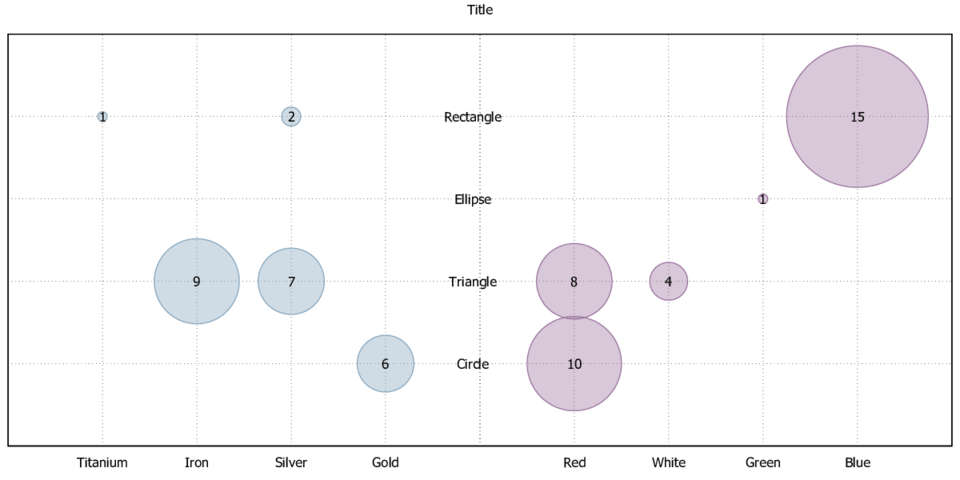
#### Bubble Chart Text
### Column and Bar Charts
#### Basic Bar
#### Basic Column
#### Column with Negative Values
#### Stacked Column
#### Stacked Percentage Column
### More Chart Types
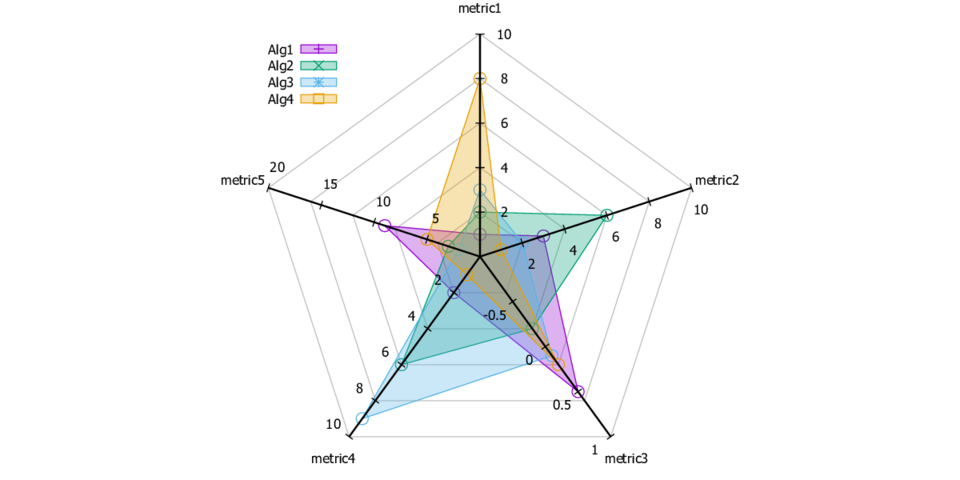
#### Spiderweb
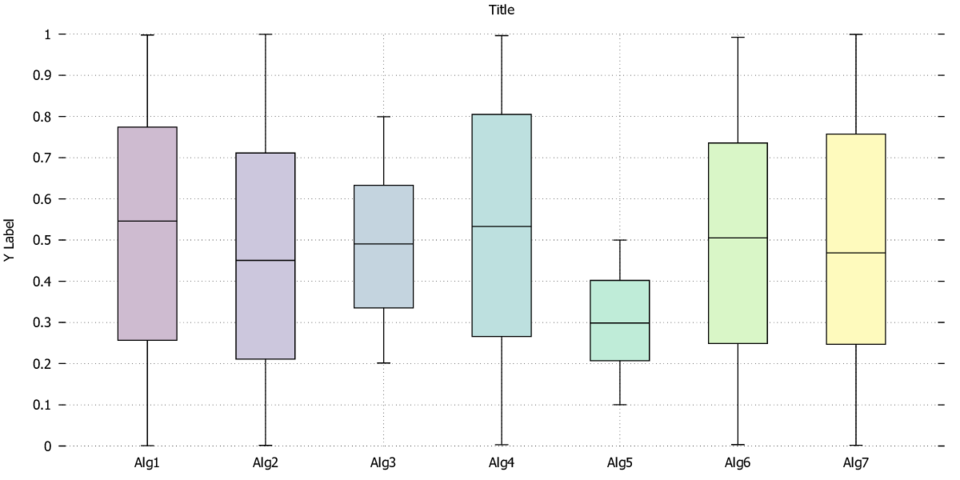
#### Box Plot
#### Heat Map
## Questions or Suggestions
Feel free to create issues here as you need
## Contribute
Contributions to the this project are very welcome! We can't do this alone! Feel free to fork this project, work on it and then make a pull request.
## Authors
* **Thiago Ferreira** - *Initial work*
See also the list of [contributors](https://github.com/iselab-dearborn/gnuplot-scripts/graphs/contributors) who participated in this project.
## License
This project is licensed under the MIT License - see the [LICENSE](LICENSE) file for details
## Powered by
A comprehensive collection of Gnuplot examples
[](https://github.com/iselab-dearborn/gnuplot-scripts/actions/workflows/png.yml)
[](https://github.com/iselab-dearborn/gnuplot-scripts/releases/latest)
[](https://github.com/iselab-dearborn/gnuplot-scripts/graphs/contributors)
[](https://github.com/iselab-dearborn/gnuplot-scripts)
[](https://opensource.org/licenses/mit-license.php)
[](https://github.com/ellerbrock/open-source-badges/)
## Usage
Firstly, install Gnuplot on your machine. Secondly, by using Console, run the gnuplot script with the following command:
```sh
gnuplot script.gnu
```
## Examples
Click in the figures to go directly to the gnuplot script.
### Line and Area Charts
#### Basic Line
#### Area Plot
### Scatter and Bubble Charts
#### Scatter Plot
#### Bubble Chart
#### Bubble Chart 3D
#### Bubble Chart Text
### Column and Bar Charts
#### Basic Bar
#### Basic Column
#### Column with Negative Values
#### Stacked Column
#### Stacked Percentage Column
### More Chart Types
#### Spiderweb
#### Box Plot
#### Heat Map
## Questions or Suggestions
Feel free to create issues here as you need
## Contribute
Contributions to the this project are very welcome! We can't do this alone! Feel free to fork this project, work on it and then make a pull request.
## Authors
* **Thiago Ferreira** - *Initial work*
See also the list of [contributors](https://github.com/iselab-dearborn/gnuplot-scripts/graphs/contributors) who participated in this project.
## License
This project is licensed under the MIT License - see the [LICENSE](LICENSE) file for details
## Powered by